Here at Sensor Tower we handle large volumes of data, so to keep things snappy for our customers we need to think carefully about how we process and serve that data.
Understanding the data we’re handling is a fundamental part of improving the way we serve it, and by analyzing how an important backend service worked, we were able to speed it up by a factor of four.
This post was originally posted in the Sensor Tower blog.
Background
We have many user-facing endpoints in Sensor Tower. So many, in fact, that we have numerous dashboards to keep tabs on how the system behaves.
A few months ago, we noticed that a particular and very important endpoint was very sluggish: While all the other endpoints of the same type had <50ms latencies, this particular service took a leisurely 300 to 500ms to respond. Here’s a diagram of how that looked:
The customer doesn’t look very happy up there! So, we decided to take some time and do an in-depth analysis of that endpoint.
Okay, now to a more serious diagram. Here’s what that endpoint looked like:
The numbered steps in the diagram above perform the following operations: 1. Decode a Protobuf string and build a Ruby object from it; 2. Modify the object; 3. Encode the Ruby object back to Protobuf.
In essence, the endpoint receives Protobuf-encoded strings, does some work on them, and returns a processed version of the Protobuf-encoded string to the client. If you don’t know what Protobuf is, that’s okay; I didn’t either. You can think of it as something similar to JSON: A serialized tree structure encoded using a binary format rather than text.1
Once we pinpointed that the endpoint slowness was due to Protobuf parsing, the next step was to try and find bottlenecks in the algorithm. The proper way to do this (which is not to just to read the code thoroughly) is by using a profiler.
With the help of ruby-prof (generate profile data) and KCacheGrind (view profile data), we were able to identify two methods, #find_all and #encode, that took a large portion of the CPU time:
While a profiler is a useful tool to identify potential problems, it has its limitations. Profiling helps you visualize data from a single run through your code. That might be fine if you’re analyzing a simple algorithm that deals with very homogeneous input, but is not really enough in the case of our back-end service, which receives thousands of very different inputs every hour.
In other words, we also needed to validate the profiler results with more data.
Taking this understanding into account, we opted for benchmarking a few thousand requests. Specifically, we benchmarked the #find_all and #encode methods and found out that, while the time they consumed relative to the total time varied, the sum of those two methods took almost 100 percent of the total time of the entire endpoint. At this point we knew we could focus our attention on these two methods.
Naturally, the first step was to understand what each of those methods did.
#find_all is responsible for decoding and modifying the object (steps one and two in the diagram), while #encode is exactly what the name implies: It re-encodes the modified Ruby object back to Protobuf (step three).
With that said, let’s go through the optimizations performed in both of these methods.
First Optimization: Encode
Before we dive into the first optimization, let’s first explain how exactly the encoding/decoding processing works. Here’s an overview of what they do:
There are two things we need to point out about this decoding/encoding process that might not be obvious:
- Both encoding and decoding work recursively, starting at the root and finding their way down to the leaves;
- Each node in the Ruby object also contains the original Protobuf string for that node. So for instance the node
Cin the example above also contains the following string:"{ C: { B: [A]}, F: [D, X1] }"; the nodeBcontains this other string:"{ B: [A] }", and so on.
Now we’re ready to understand the actual optimization.
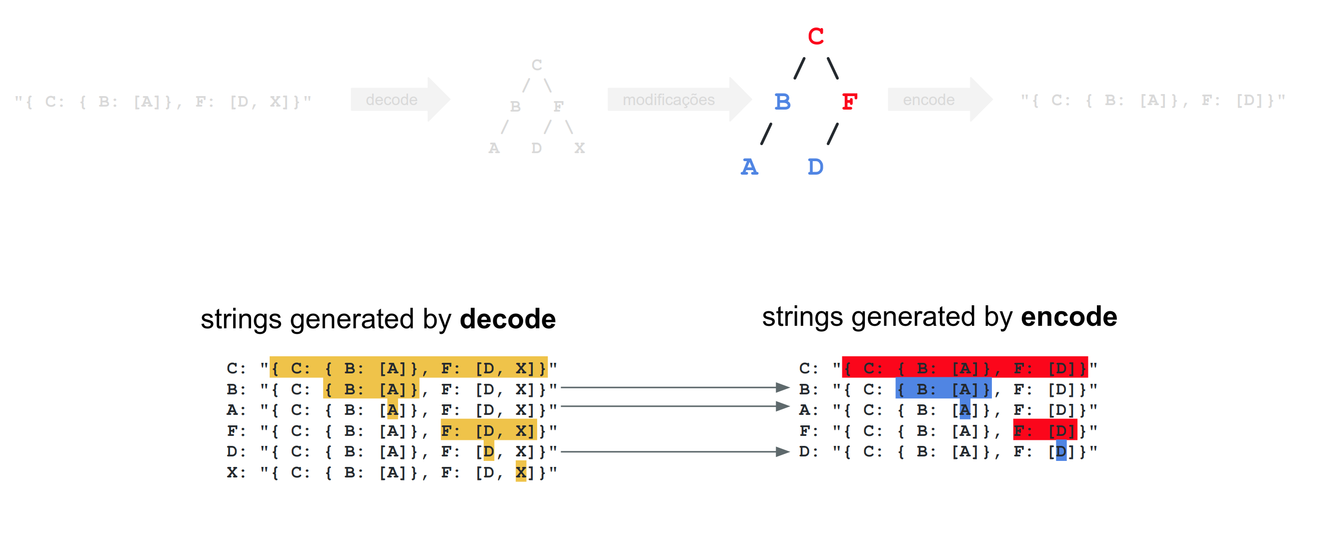
Let’s take a detailed look at the modification process:
One of the most fundamental steps of any optimization is avoiding repeated work. If we look closely, we can see that the nodes in blue (A, B, D) were not modified: Look at the strings generated by decode (left side, in yellow) and compare them with the ones generated by encode (blue, to the right)—they’re identical! Conversely, nodes in red (C, F) were indeed modified: The strings are different. So, now we know there is some potentially repeated work going on.
The first optimization leveraged this repeated work. Instead of always encoding every single node, we now encode only those nodes that were modified. All the rest of the nodes already have a valid Protobuf string stored as an instance variable, and that string is identical to what we would obtain if we were to run #encode on them.
The actual code change to implement this was quite simple: Just a matter of adding a dirty flag to each node, and marking the node as @dirty = true if it or one of its descendants was modified.
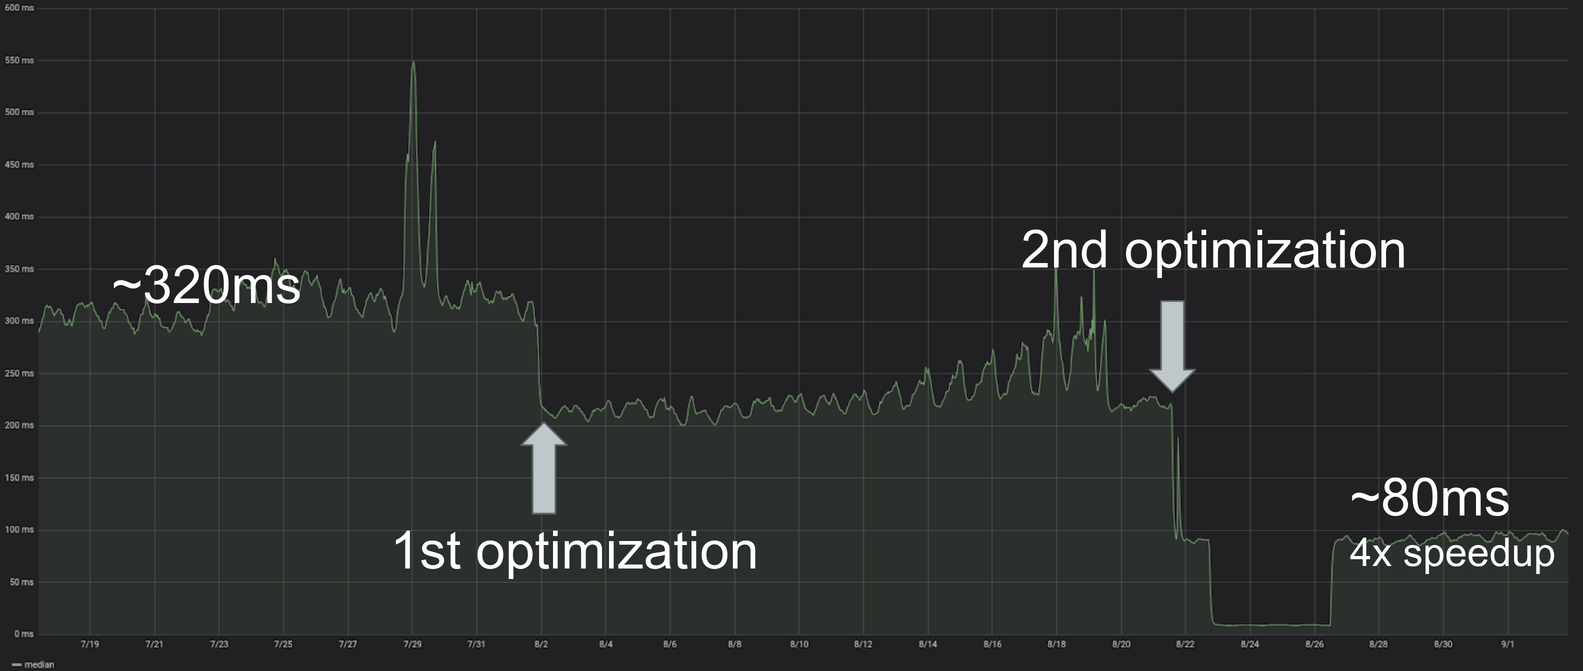
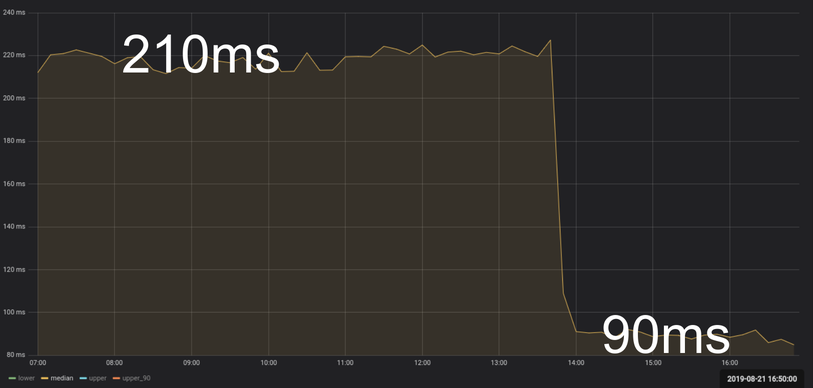
This optimization alone reduced the endpoint’s execution time by 30 percent. Here’s the execution time chart right after deploying the optimization:
Second Optimization: Finding a Node
The first optimization worked on the #encode method, so the natural next step was to look at the other time-consuming method, #find_all.
As we briefly mentioned, #find_all is responsible for two things: Decoding the Protobuf string into a Ruby object and modifying the object itself.
Unfortunately, there is no way of knowing beforehand if we’ll need to modify anything or not, so we’ll always have to do the decoding step. But what about the other thing #find_all does, modifying the object?
Before diving in, let’s recall a few things: 1. Protobuf is a tree-based data structure; 2. The trees we receive have no internal order to take advantage of; 3. Our algorithm searches for specific nodes and removes them from the tree; 4. We don’t know what the trees look like beforehand.
Before this optimization, #find_all was running a simple tree traversal to try and find those specific nodes mentioned in step three above. This is an acceptable approach when your input is small or when you’re not too worried about response time, but when you have massive inputs and want to deliver the smallest possible runtime, tree traversals can be a problem: They have linear time complexity (O(n), where n is the number of nodes).
Once we know the path to a node, though, accessing it is very cheap: It can be done in logarithmic time, O(log n). This is possible because of a mathematical property of trees: Tree height is roughly a logarithmic function of the amount of nodes (it might degenerate into a linear function as well, but let’s leave those explanations to the textbooks), thus the average-case maximum path length to a node (that is, from the root down to the deepest leaf) is also bound to that same logarithmic constraint.
So, we started looking closely to which paths we were going through to access those few nodes we wanted to remove. Ideally, there would be a single, universal path found in all the trees we ever encounter. That, way we could store that single path and always be guaranteed of finding the nodes we want to. Conversely, the worst possible outcome would be that every tree had a unique path to those nodes.
The truth lied somewhere in between those two extremes (thankfully for us, it leaned more towards the former rather than the latter). Here’s a chart of the amount of different paths we found over time (the two curves represent paths to two of the nodes we want to remove):
Without going into too much detail about that chart, just notice that it is very logarithmic! This is excellent for us, because it means that with a relatively small amount of paths we can find a very large percentage of the total nodes we want to find (and for the few we don’t, not finding them is okay). The next chart compares what we actually found (logarithmically growing paths) with the worst possible scenario mentioned previously:
So, the second optimization was, in the end, also very simple: We simply collected a large enough amount of different paths and then traversed to them in logarithmic time instead of doing a full tree traversal that takes linear time to find the nodes we wanted to modify. This was responsible for a 300 percent speedup:
Caveats
You might have noticed that this method is not perfect in the sense that it doesn’t always find all the nodes that we would’ve found using a complete tree traversal. This is quite true: The optimization comes with an accuracy trade-off. While this might be a deal-breaker for systems where you actually need 100 percent accuracy at all times, this wasn’t really a problem for us; Missing a few nodes out of the several thousand we process each hour wasn’t really a big deal.
As time passes, however, and different trees keep coming in, the precision of this approach eventually declines to a level that is significant even for our not-too-strict requirements. This happens slowly, because of how different paths appear (following a logarithmic function), but surely—our accuracy was ever-descending because we had used a fixed number of paths.
After employing our optimized algorithm to the payload and responding to the request, we post-process a subset of the the requests in the background and dynamically update the path definitions. This way, we always have a very high success rate on the parsing but keep the latency of responding to a particular request low.
Final Results
Here’s a chart showing our execution time before and after we rolled out both optimizations:
We effectively reduced execution time from 300-500ms to 80ms with almost no impact to the user.
Notes
-
Protobuf, or Protocol buffers, is a binary serialization method developed by Google. ↩


